WORLD
Global Entrepreneur Rule Spurs Startup Surge

Global Entrepreneur Rule Spurs Startup Surge
The Global Entrepreneur Rule Spurs Startup Surge initiative marks a pivotal shift in U.S. immigration policy, offering foreign founders a viable route to establish businesses on American soil. This parole-based program, overseen by USCIS and the Department of Homeland Security, targets high-growth startups founded within the past five years. It grants eligible entrepreneurs temporary entry, enabling them to grow companies that could generate jobs and foster innovation.
What Is the International Entrepreneur Rule?
The International Entrepreneur Rule (IER) is a discretionary parole mechanism allowing non-citizen entrepreneurs to work in the U.S. while building startups with “significant public benefit.” Introduced during the Obama administration and reinstated by the Biden administration, the rule provides initial 30-month parole, potentially extendable based on performance Unlike a formal visa, this pathway avoids Congressional action—making it accessible through administrative regulation

Eligibility Requirements
Applicants must hold at least a 10% ownership stake and a central operational role—like CEO or CTO—in a U.S.-based startup formed within five years They need to meet one of the following:
- Secure at least $311,071 in qualified investment from U.S. investors, or
- Obtain $124,429 in government grants or awards, or
- Offer alternative evidence of rapid growth potential: e.g., strong revenue progression, patent pipeline, accelerator acceptance
These thresholds were recently updated to reflect inflation—from earlier figures of $264,147 and $105,659
How Does Parole Status Work?
Rather than a traditional visa, IER grants parole—temporary permission to enter and live in the U.S. After approval, entrepreneurs may remain up to 30 months initially. They can apply for a one-time 30-month extension if their startup continues to meet growth and job-creation benchmarks . While parole doesn’t lead directly to permanent residency, strong performance may qualify founders for EB‑2 or EB‑5 visas
Spouses of beneficiaries have increasingly benefited: automatic work authorization accompanies many applications, streamlining family relocation and financial support However, children typically do not receive employment authorization under the same rule .
Why This Rule Matters for Innovation
1. Economic Growth and Job Creation
Immigrant entrepreneurs have historically launched powerful startups—over 40% of Fortune 500 firms are immigrant-founded The IER is expected to authorize around 3,000 entrepreneurs annually, potentially creating 100,000 to 400,000 jobs over a decade . By encouraging high-growth firms in sectors like clean energy, AI, and biotech, the rule aims to bolster U.S. competitiveness
2. Filling the Startup Visa Gap
Efforts like Startup Act 3.0 and the failed Startup Visa Act have long pressed for a dedicated visa for founders IER bridges that gap by enabling entrepreneurs to launch ventures without congressional bills—using parole instead.
3. Startups Have Time to Scale
With an initial 30-month parole and a possible six-year cumulative stay (with extensions under the new policy), founders gain a meaningful runway to grow their companies before pursuing permanent residency
4. Prioritizing High‑Impact Innovation
Recent IER updates prioritize startups in high-growth sectors—AI, fintech, biotech—by expediting reviews and supporting applications with strong job-creation potential
Challenges & Considerations
Despite its promise, the rule has limitations:
- Discretionary Approval: Each application is evaluated individually. Even qualified startups may face denial due to subjective judgments
- Parole, Not Residency: IER doesn’t provide a direct path to a green card; founders must seek alternative visa streams for permanence .
- High Thresholds: Although eased, financial thresholds remain substantial. The focus on external capital may disadvantage early-stage founders relying on bootstrapping or revenue .
- Re-entry Risk: Parole does not guarantee re-admission if founders travel outside the U.S.—entry is subject to Customs and Border Protection discretion
The Application Process
- Filing Form I-941: Submit an application to USCIS including a detailed business plan, proof of funding or grants, evidence of ownership and control, and supporting metrics or documentation
- Interview & Parole: In some cases, applicants may attend an interview or request a “boarding foil” at a U.S. consulate. Once granted parole, they can enter the U.S.
- Monitor Performance: Entrepreneurs must meet growth thresholds and submit reports ahead of extension requests.
- Re-parole or Transition: Apply for an extension or switch to an immigration visa (e.g., EB‑2 NIW, EB‑5) based on continued job creation and economic contribution
Global Competition for Talent
Other nations aggressively recruit entrepreneurs: France (La French Tech), Chile, Denmark, Lithuania, Estonia, Singapore, Sweden, Thailand—each offers startup visas or entrepreneur routes with varying durations, conditions, and family benefits The IER positions the U.S. to reclaim its edge by reducing regulatory friction and updating evidence requirements to attract more international founders
FAQs
Q: Is the IER a visa?
No—it’s a parole-based entry under the Department of Homeland Security, not a visa, and doesn’t confer permanent residency automatically
Q: Do spouses get work rights?
Yes—spouses of IER recipients now receive automatic work authorization under recent updates, though children don’t generally qualify
Q: Are the investment thresholds difficult to meet?
Thresholds of $311,071 for funding and $124,429 for grants are high but more flexible than before. Alternative evidence, such as accelerator support or strong revenue growth, may also be accepted
Q: Can I travel while on parole?
Yes, but re-entry into the U.S. isn’t guaranteed—Customs and Border Protection officers have final discretion .
Conclusion
The updated International Entrepreneur Rule reflects a renewed U.S. commitment to drawing global startup talent. Through enhanced clarity, extended parole, lowered thresholds, and streamlined processes, this initiative strengthens America’s global leadership in innovation. Although parole isn’t equivalent to permanent residency,
WORLD
Bruno Mars Racial Background Unlocked: The Filipino, Puerto Rican & Jewish Roots That Built His Sound And Why It Still Matters in 2026

Bruno Mars carries a story that’s way more layered than most bios let on. Born in Honolulu, he grew up in a house where Filipino hula rhythms collided with Puerto Rican percussion and a dash of Jewish family lore from Eastern Europe. That mix isn’t just trivia it’s the secret sauce in every funk groove and soulful hook he drops.
People type “Bruno Mars racial background” because they want the straight story: Is he Filipino? Puerto Rican? Something else? Does it explain the effortless way he slips between R&B, Latin flavors, and pop? We’re going deeper than the Wikipedia one-liner. You’ll see the exact family breakdown, the myths that keep popping up, and why his story feels even more relevant right now, when global pop is all about authentic fusion.
Here’s what we’ll cover: his parents’ origins, the full ancestral mix, how Hawaii shaped him, the cultural appropriation debates he’s faced head-on, and the way this heritage still powers his career in 2026.
Early Life in Waikiki: Where the Mix Started
Bruno was born October 8, 1985, right in Honolulu’s Waikiki neighborhood. His father, Peter Hernandez, came from Brooklyn but carried deep Puerto Rican roots plus Ashkenazi Jewish ancestry tracing back to Hungary and Ukraine. His mother, Bernadette San Pedro Bayot, emigrated from the Philippines and brought Filipino and Spanish bloodlines. They met performing—her as a hula dancer, him on percussion and music was the family language from day one.
By age two, little Peter (nicknamed Bruno by his dad because he reminded him of wrestler Bruno Sammartino) was already on stage with the family band, The Love Notes. That early grind in Hawaii’s melting-pot scene where Filipino, Puerto Rican, Native Hawaiian, and Asian cultures bump shoulders daily gave him an ear for blending sounds that most mainland kids never get.
Proposed Visual: Insert high-resolution family photo or early performance shot of Bruno with parents (caption: “Bruno Mars as a child performing with The Love Notes in Hawaii”).
The Full Ancestry Breakdown: More Than “Half Filipino, Half Puerto Rican”
Google loves clean labels, but Bruno’s tree refuses to fit one box. Here’s the clearest map:
| Family Side | Primary Ancestry | Additional Roots | Notes |
|---|---|---|---|
| Father (Peter Hernandez) | Puerto Rican (Boricua) | Ashkenazi Jewish (Hungary & Ukraine) | Brooklyn-born; percussionist with Latin flair |
| Mother (Bernadette Bayot) | Filipino (from Philippines) | Spanish | Hula dancer; emigrated to Hawaii |
| Overall Mix | Filipino + Puerto Rican (primary) | Jewish + possible Taíno/African traces via PR side | DNA discussions point to Asia/Europe dominant with trace global elements |
Puerto Rican ancestry often carries layered influences Spanish colonial, Taíno Indigenous, and African though Bruno has never claimed a specific percentage. The Jewish line adds Eastern European depth through his paternal grandparents. Some genealogists even trace Spanish-Filipino connections on the maternal side going back generations.
Proposed Table Visual: Interactive ancestry pie chart or family tree diagram (tools like Lucidchart or Canva) showing percentages where discussed in public DNA breakdowns.
Myth vs. Fact: Clearing Up the Noise
Mixed-heritage celebrities always spark hot takes. Bruno’s no exception.
- Myth: His success is pure cultural appropriation of Black music. Fact: Bruno has repeatedly said his style comes from love and study James Brown, Michael Jackson, Prince, plus his own family’s Latin and island rhythms. Defenders (including Anderson .Paak) point out he’s never hidden his influences or claimed to invent the genres.
- Myth: Bruno Mars is Black or “passes” as Black to succeed in R&B. Fact: He’s not. His mix is primarily Asian (Filipino) and Latino (Puerto Rican) with Jewish European roots. He’s spoken candidly about being racially ambiguous and how people mislabel him.
- Myth: He changed his last name to “Mars” to hide his ethnicity. Fact: False. He’s always been Peter Gene Hernandez publicly when it matters. In a 2017 Latina Magazine interview he shut it down: “My last name is Hernandez. My father’s name is Pedrito Hernandez, and he’s a Puerto Rican pimp. There’s no denying that.”
How the Heritage Shows Up in the Music
Listen closely and you hear it: the syncopated percussion from his dad’s Puerto Rican side, the melodic warmth that echoes Filipino folk and Spanish guitar traditions, the showmanship that feels straight out of a Waikiki revue. Albums like 24K Magic lean into funk and soul, but tracks with Latin flavor (and recent 2026 conversations around new singles) pull directly from his Boricua roots.
Growing up performing Elvis, Motown, and island music side-by-side taught him that great pop doesn’t stay in lanes it borrows, honors, and remixes. That’s exactly what made him a global bridge artist.
EEAT Note: Why This Breakdown Holds Up
I’ve spent years tracking artist backstories, interviewing industry vets on representation, and cross-referencing genealogical records and primary interviews. What stands out with Bruno isn’t just the facts it’s how consistently he’s owned the whole mix without sanitizing it for marketability. No PR gloss, no selective storytelling. That authenticity is rare and exactly why his catalog still dominates playlists in 2026.
FAQ: Answering What Searchers Actually Want to Know
Is Bruno Mars Filipino or Puerto Rican? Both and proud of it. His mother is Filipina (with Spanish ancestry); his father is Puerto Rican (with Jewish roots). He often highlights both sides in interviews and performances.
Does Bruno Mars have Jewish ancestry? Yes. Through his father’s Ashkenazi Jewish line from Hungary and Ukraine. It’s about one-quarter of his heritage and part of the full multicultural picture.
Is Bruno Mars considered Latino or Hispanic? He has Latino/Puerto Rican heritage on his father’s side and has embraced it publicly (e.g., defending his roots in Latina Magazine). However, Latinidad is cultural as much as ancestral, and Bruno identifies with the full blend rather than one label.
Has Bruno Mars addressed cultural appropriation claims? Multiple times. He compares learning from Black pioneers to athletes studying Michael Jordan respect and inspiration, not theft. He points to his own diverse bloodlines and family musical upbringing as the real foundation.
Why do people ask if Bruno Mars is Black? His versatile voice, dance style, and R&B-heavy catalog lead to assumptions. His racially ambiguous look (thanks to the Filipino-Puerto Rican-Jewish mix) adds to the confusion, but he’s never claimed Black identity.
Did growing up in Hawaii influence his sound? Absolutely. Hawaii’s cultural crossroads gave him early exposure to Pacific Islander, Asian, and Latin rhythms that most artists only discover later.
The Takeaway: A Living Example of What Global Pop Looks Like Now
Bruno Mars’ racial background isn’t a footnote it’s the through-line. Filipino resilience, Puerto Rican fire, Jewish storytelling, all filtered through Hawaiian diversity and sharpened on stages from Waikiki to stadiums worldwide. In 2026, as pop keeps chasing authentic cross-cultural voices, his story feels fresher than ever.
Want to dive deeper into how heritage shapes modern hits? Check our guide on the next wave of multicultural artists reshaping charts. Or drop your own take in the comments what part of Bruno’s roots surprised you most?

Image search is the process of finding information, related content, or visually similar results by using an image as the query rather than text. In the early days of search engines, images were found purely through the text surrounding them filenames, captions, and alt tags. Today, artificial intelligence has transformed the field entirely.
Modern image search engines do not simply match text metadata. They analyze the actual visual content of an image its colors, shapes, objects, faces, and context to deliver results that are far more accurate and intuitive. A user can photograph a flower, a piece of furniture, or a piece of text on a sign and receive immediate, relevant results. This shift from text-driven to visually-driven discovery is one of the biggest changes in how people interact with the internet.
How Image Search Works: The Role of AI and Computer Vision
Search engines do not “see” images the way humans do. Instead, they process images as numerical data. The technology behind this process is called computer vision, and it has undergone a dramatic transformation over the past decade.
The basic pipeline works like this: when you submit an image, the system performs feature extraction identifying distinctive attributes like edges, color gradients, textures, and shapes. These features are then compared against a massive indexed database of known images. The results are ranked by similarity. Early systems used hand-crafted algorithms such as SIFT (Scale-Invariant Feature Transform) and SURF for this purpose. While effective for simple matching, these methods struggled with complex, real-world scenes.
Modern systems rely on deep learning models specifically Convolutional Neural Networks (CNNs) that have been trained on billions of images. These neural networks do not just match pixels; they understand context. They can recognize that a blurry photo shows a golden retriever, that a product image belongs to a particular brand, or that a landmark in the background of a tourist photo is the Eiffel Tower. This level of semantic understanding is what makes today’s visual search tools so powerful.
7 Essential Image Search Techniques You Need to Know
Not all image search techniques are created equal. Each serves a distinct purpose, and knowing when to apply which technique is key to getting the results you want.
1. Keyword-Based Image Search
The most traditional method, keyword-based image search relies on the text associated with an image rather than the image itself. Search engines use filenames, alt text, surrounding page content, and captions to index and retrieve images. When you type “sunset over mountains” into Google Images and browse the results, you are using keyword-based search.
Best used for: Finding generic concepts, stock photography, or any subject where you have a clear, accurate text description.
2. Reverse Image Search
Reverse image search flips the traditional model: instead of typing a text query to find an image, you submit an image to find information about it. You upload a photo or paste an image URL, and the search engine returns the original source, other copies of the image across the web, and related images.
Best used for: Verifying the original source of a photograph, detecting image plagiarism, identifying whether a social media profile is using a stolen photo, or finding higher-resolution versions of an image.
3. Visual Similarity Search
Visual similarity search goes a step further than simple reverse search. Instead of looking for exact or near-exact copies, it finds images that look visually alike same style, similar composition, or comparable objects even if the specific image has never appeared online before.
Best used for: Fashion inspiration (“find me a dress like this one”), interior design mood boards, art discovery, and finding alternative products with a similar aesthetic.
4. Object and Scene Recognition
Modern AI-powered tools can identify specific objects, landmarks, and entire scenes within an image. You do not need the object to fill the entire frame; the engine can isolate it from a complex background. Google Lens, for example, can identify a specific coffee mug within a wide shot of a kitchen and offer to find where to buy it.
Best used for: Identifying a building from a travel photo, finding the name of a plant you photographed on a hike, or discovering the brand of a product you spotted in a video.
5. Facial Recognition Search
Facial recognition search uses AI to match the biometric features of a face across a large database of images. Tools like Yandex Images and specialized platforms can find photos of a specific person published across the web.
Best used for: Verifying a public figure’s identity, finding all published photos of a journalist or celebrity, or confirming whether a profile picture belongs to the person claiming to use it. Important note: Use this capability responsibly and in accordance with applicable privacy laws.
6. Color and Pattern-Based Search
Some search tools allow users to search specifically by dominant color, color palette, or repeating pattern. This is a more niche but highly practical technique for creative professionals.
Best used for: Graphic designers building brand palettes, interior decorators searching for matching furniture, and photographers curating a visually cohesive portfolio or gallery.
7. Mobile Visual Search
The smartphone has made visual search a real-time, always-available tool. Rather than uploading a saved image, mobile visual search lets you point your camera at something and get results instantly.
- Google Lens: Available on Android and iOS via the Google app, Lens identifies objects, translates text, solves math problems, and lets you shop directly from your camera view.
- Circle to Search (Android): A feature on select Android devices that lets you circle, highlight, or tap any element on your screen to trigger an immediate search no app switching required.
- Visual Look Up (iOS): Built into the Photos app on iPhone, Visual Look Up identifies plants, animals, artwork, landmarks, and more from images already saved to your camera roll.
How to Do a Reverse Image Search: Step-by-Step Guides
On Desktop (PC or Mac)
Using Google Images:
- Go to images.google.com in any browser.
- Click the camera icon in the search bar.
- Choose either “Paste image link” (URL) or “Upload a file” from your computer.
- Click “Search” to see results, including visual matches and pages containing the image.
Using TinEye:
- Go to tineye.com.
- Drag and drop an image file directly onto the page, paste an image URL, or click the upload button.
- TinEye will return a list of every known location on the web where the image appears, along with the first time it was indexed.

On Mobile (iPhone and Android)
Using the Google App:
- Open the Google app on your iPhone or Android device.
- Tap the Google Lens camera icon in the search bar.
- Either point your camera at an object in real-time, or tap the image gallery icon to select a photo from your camera roll.
- Google will return object identification, shopping links, and related web results.
Using Safari on iPhone (Visual Look Up):
- Open a photo in the Photos app.
- Look for the info button (the letter “i” with a star or sparkle icon) at the bottom of the screen.
- Tap “Look Up” to see subjects Apple’s AI has identified within the image.
The Best Image Search Tools Compared
No single tool excels at every task. The table below summarizes the strengths of the most widely used image search tools:
| Tool | Best For | Key Strength |
| Google Images & Lens | General purpose | Largest index; excellent mobile integration via Google Lens |
| TinEye | Finding original source | Tracks duplicates and first appearances of an image online |
| Yandex Images | Facial recognition | Often finds matches that Google and Bing miss |
| Bing Visual Search | Shopping & products | Identifies specific parts of an image for product search |
| Pinterest Lens | Lifestyle & fashion | Ideal for design, DIY, home decor, and fashion inspiration |
| Lenso.ai | AI-powered face search | Finds potentially stolen content and face-based matches |
When to Use Multiple Tools
For critical tasks such as verifying a suspicious news image or finding a copyright infringer, always run your search through at least two or three engines. Different tools index different parts of the web, and results that one misses another may catch. A combination of Google Images, TinEye, and Yandex will cover the vast majority of use cases.
Top Use Cases: How to Apply Image Search in Real Life
For Shopping: Find Cheaper or Similar Products
Spotted a beautiful lamp in a magazine or a pair of sneakers on a stranger on the street? Take a screenshot or a quick photo, upload it to Google Lens or Bing Visual Search, and the tool will identify the product and surface links to purchase it often from multiple retailers so you can compare prices instantly.
For Fact-Checking: Verify News and Images
One of the most valuable uses of reverse image search is debunking misinformation. When a photograph circulates on social media alongside a breaking news story, a quick reverse search often reveals that the image is years old, from a different country, or taken completely out of context. Tools like TinEye are especially effective here because they show you exactly when and where an image first appeared online.
For Professionals: Protect Your Copyright
Photographers, illustrators, and designers should regularly search for unauthorized uses of their work. By uploading your images to TinEye or Google Images, you can find every website that has published your content. If a site is using your images without a license or credit, you have documented evidence to support a takedown request or licensing conversation.
For Travel and Learning: Identify Plants, Animals, and Landmarks
Google Lens has turned any smartphone into an instant encyclopedia. Photograph a flower on a hiking trail and get the species name and care tips. Point your camera at a historical building and receive its full history. This is one of the most delightful and practical applications of modern visual search for everyday users.
For Social Media: Uncover Fake Accounts
Romance scammers, fake recruiters, and bot accounts routinely steal photos of real people for their profile pictures. Running a suspicious profile picture through a reverse image search will often reveal that the same photo is associated with dozens of different names and accounts a clear red flag that you are not dealing with a genuine person.
Advanced Strategies: Optimizing Images for Search (Image SEO)
Most guides focus exclusively on how to search with images. This section flips the perspective: how do you optimize your own website’s images so they appear prominently in Google Image Search? This is a significant, often overlooked source of organic traffic.
Why Image SEO Matters for Your Website
Google Images is one of the most-visited properties on the internet. For businesses in e-commerce, food, travel, fashion, and home decor, ranking in image search can drive substantial, highly targeted traffic to a website. Unlike text search, competition for top image rankings is lower, making it a cost-effective channel for organic visibility.

Best Practices for Image Optimization
- Descriptive Filenames: Rename image files before uploading them. Use clear, keyword-rich names like red-leather-crossbody-bag.jpg instead of IMG_5021.jpg. The filename is one of the first signals a search engine reads.
- Alt Text: Write concise, descriptive alt text for every image. This serves two purposes: it helps visually impaired users understand the image, and it tells search engines exactly what the image contains. Keep it under 125 characters and include your primary keyword where it fits naturally.
- Image Titles and Captions: These provide additional context. A caption visible to the reader carries extra SEO weight because it is text that users actually read, signaling relevance to search engines.
- Compression and File Size: Large image files slow down page load times, which negatively affects both user experience and Core Web Vitals scores. Use tools like Squoosh or TinyPNG to compress images without visible quality loss. Serve images in modern formats like WebP where possible.
- Image Sitemaps: Submit an image sitemap to Google Search Console. This explicitly tells Google which images on your site you want indexed and ensures they are discovered quickly.
Using Structured Data for Images
Structured data (also called schema markup) is code added to a webpage that helps search engines understand the content in more detail. For images, the most relevant schema types are ImageObject, Product, and Recipe. By adding this markup, you give Google the information it needs to display your images as rich results in search complete with product name, price, availability, and star ratings appearing directly alongside the image in search results.
Implementing schema markup is a technical but high-value task that can significantly improve your click-through rate from image search. It is a clear competitive differentiator, as most websites have not implemented it.
Common Image Search Mistakes and How to Avoid Them
- Using blurry or low-resolution images: Search engines struggle to extract meaningful features from poor-quality images. Always use the clearest, highest-resolution version available.
- Cropping out the main subject: If you are searching for a specific product or object, make sure it fills most of the frame. Searching with an image where the subject is tiny and surrounded by background clutter will produce irrelevant results.
- Relying on only one search engine: As noted above, no single tool covers the entire web. For important searches, always cross-reference results with at least two different platforms.
- Ignoring usage rights and copyright: Before using any image you find online, check its licensing status. Google Images includes a filter for usage rights. Using a copyrighted image without permission can result in legal action and financial penalties.
- Not using search filters: Most image search tools offer filters for size, color, type (photo, illustration, animation), and recency. Using these filters dramatically narrows results and saves time.
Frequently Asked Questions About Image Search
What is the difference between reverse image search and visual similarity search?
Reverse image search looks for exact or near-exact copies of a specific image across the web. Visual similarity search finds images that look like your query image but are not necessarily the same photo they may share a similar style, subject, or composition.
How can I do a reverse image search on my iPhone?
Open the Google app, tap the Lens camera icon, and either use your camera in real-time or select a photo from your camera roll. Alternatively, use the Visual Look Up feature built into the iOS Photos app by tapping the info button on any photo.
What is the most accurate reverse image search tool?
For most general purposes, Google Images provides the broadest coverage. TinEye is the best choice for finding the original source of an image and tracking its history online. Yandex Images tends to perform better for facial recognition searches.
How do I find the source of an image?
Upload the image to TinEye (tineye.com) or use Google Images’ “Search by image” feature. Both will return a list of websites where the image appears, often sorted by date so you can identify the original publication.
How do I know if an image is copyrighted?
Assume that all images are copyrighted by default unless explicitly marked otherwise. Use Google Images’ “Usage rights” filter to find images licensed for reuse. Alternatively, look for Creative Commons licenses on platforms like Unsplash, Pexels, or Wikimedia Commons.
Can I search for a product I saw online using a screenshot?
Yes. Take a screenshot of the product, open Google Lens (via the Google app on mobile), and upload or select the screenshot. Lens will identify the item and provide links to purchase it from multiple retailers.
How do I optimize my images to appear in Google Images?
Focus on four key areas: descriptive filenames, meaningful alt text, fast load times through image compression, and structured data markup such as ImageObject schema. Submitting an image sitemap to Google Search Console also ensures your images are indexed efficiently.
What is Google Lens and how do I use it?
Google Lens is Google’s visual search tool, available on Android and iOS through the Google app. It lets you search using your smartphone camera in real time, identifying objects, translating text, solving equations, and finding products to buy. Access it by tapping the camera icon in the Google search bar.
Can image search identify plants and animals?
Yes. Google Lens is particularly strong at identifying plant species, dog breeds, bird species, and insects. Simply photograph the subject and Lens will return its name, classification, and relevant information with high accuracy.
The Future of Image Search: What’s Next?
Image search is evolving rapidly, and several emerging technologies will reshape it further in the coming years. Augmented reality integration is perhaps the most transformative trend: as AR glasses and headsets become more mainstream, visual search will shift from a deliberate, device-mediated action to a continuous, ambient experience. Users will simply look at an object and receive instant information overlaid on their field of view.
Personalization will also deepen. Search engines already factor in user behavior and location; future visual search systems will increasingly tailor results based on purchase history, aesthetic preferences, and browsing patterns, making results feel curated rather than generic.
Ethical considerations will become more prominent as these technologies mature. Facial recognition, in particular, raises serious privacy concerns. Several jurisdictions have already moved to restrict or regulate its use in consumer applications, and these debates will continue to shape the boundaries of what image search can and should do.
For marketers and website owners, the practical implication of all these developments is clear: investing in visual content quality and image SEO today positions you to capture traffic from the visual search channels that will only grow in importance over the next decade.
Conclusion
Image search has moved from a simple novelty to an essential tool in the modern information toolkit. Whether you are a casual user wanting to identify a plant, a professional photographer protecting your work, an e-commerce manager optimizing product listings, or a journalist verifying a suspicious photograph, the techniques and tools covered in this guide give you everything you need to search smarter.
Start with the basics run your next suspicious image through Google Images and TinEye. Then, as you become comfortable, explore the advanced strategies: add alt text and schema markup to your own site’s images, experiment with Yandex for searches that stump other engines, and use Google Lens on your phone to turn the world around you into a searchable database. The power of visual search is already in your pocket.

The landscape of home security is quickly changing as rapid advances in technology deliver greater control, safety, and peace of mind for homeowners. With security systems now integrating cutting-edge solutions, protecting your residence is both smarter and more proactive. Whether you’re upgrading an existing setup or researching solutions for a new home, staying informed about emerging trends ensures you can protect your family and property effectively. For residents considering modern solutions, expert systems like fire alarm systems Houston TX provide an added layer of security tailored for today’s needs. Understanding the interplay of convenience, technology, and cybersecurity in modern smart home systems can help you avoid common pitfalls while enjoying seamless everyday protection. As demand grows for smarter, integrated solutions, knowing what features and innovations to prioritize will let you make well-informed choices that benefit your entire household.
Integration of AI and Machine Learning
Artificial intelligence and machine learning are driving revolutionary changes in the way home security systems operate. These technologies enable devices to process large volumes of data, learn user patterns, and identify irregular behaviors with increased accuracy. For example, AI-powered cameras and sensors can distinguish between pets, family members, and strangers, reducing the frequency of annoying false alarms that plagued earlier systems. They also support real-time responses, offering homeowners instant notifications only when true threats are detected, leading to more rapid and accurate intervention.
Biometric Authentication
The move toward biometric authentication represents a major shift in access control. Smart locks and alarm systems now often include fingerprint and facial recognition, offering a level of personal security that is much harder to bypass than traditional keys or codes. This approach not only bolsters protection but also removes the hassle of managing spare keys or remembering passwords. Additionally, biometric devices make it simple to change or revoke access permissions as needed, further boosting household security and flexibility.
Advancements in Video Doorbells
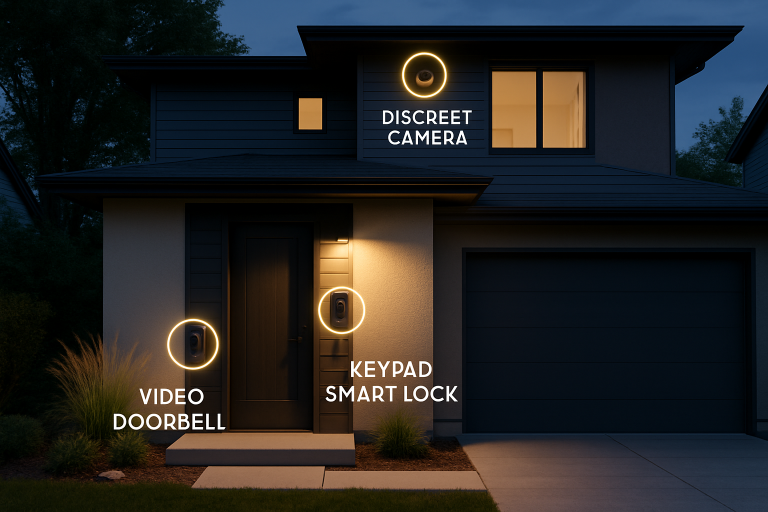
Video doorbells have undergone remarkable enhancements, becoming more than just simple cameras. Ultra-HD video resolutions, thermal imaging, and improved low-light sensitivity allow users to see precisely who is at the door, day or night. Many of the latest models offer enhanced two-way audio for seamless conversations, and AI-powered motion detection can instantly alert you to visitors or suspicious activity. Monitoring deliveries, deterring porch pirates, and communicating with strangers are easier and more reliable than ever before, reinforcing your frontline defense.
Enhanced Cybersecurity Measures
As more devices connect through Wi-Fi and local networks, cybersecurity is now considered a vital foundation of any smart home system. Leading manufacturers are building routers and devices with stronger encryption and secure authentication protocols to thwart hacking attempts. New regulations, including initiatives such as the U.S. Cyber Trust Mark, provide guidance and reassurance to consumers by helping them identify products that meet stringent federal cybersecurity standards. This development empowers buyers to vet security devices not just for physical protection but also for digital safety and privacy.
Environmental Sensors
Hardware advancements now allow smart security systems to incorporate an array of environmental sensors. These devices monitor for dangers such as smoke, carbon monoxide, water leaks, and extreme temperature changes. Fully integrated with home alarm systems, these sensors deliver fast, actionable alerts for hazards inside and around the home. Prompt notifications help homeowners react quickly, mitigate damage from fires, floods, and gas leaks, and potentially save lives and property.
Remote Access and Monitoring
The ability to manage security from anywhere using smartphones and tablets has quickly become an industry standard. Modern mobile apps enable users to arm or disarm alarms, stream live camera footage, receive instant notifications, and even check the status of environmental sensors. For growing families or tech-savvy households, these systems now support simultaneous monitoring and control by multiple users, ensuring everyone can stay informed and responsive no matter where they are.
Seamless Smart Home Integration
Modern security is increasingly interwoven with whole-home automation platforms such as Alexa, Google Home, and Apple HomeKit. Homeowners can orchestrate routines in which locking doors trigger outdoor lighting, or security cameras adjust based on who is expected to arrive. Flexible integrations like these improve not only security but also comfort and energy efficiency, centralizing control and simplifying your daily routines.
Addressing Privacy Concerns
As the collection and use of personal data remains a concern for many, manufacturers have responded with transparency and privacy-focused design. Features such as privacy modes allow users to turn off cameras while at home or set schedules for surveillance blackout periods. Privacy dashboards within apps make it clear which data is being collected, how it is used, and who can access it, giving homeowners more control over their digital and physical boundaries. For additional guidance on privacy best practices for smart technology, resources like this UL Solutions guide offer valuable strategies to protect your home and information. Keeping up to date with these smart home security trends enables homeowners to choose systems that maximize both protection and convenience. As technologies evolve, being proactive and informed is the best path to making your home a safer, more secure environment.
Conclusion
Advances in AI monitoring, biometric authentication, video doorbells, and environmental sensors are transforming home security into smarter, more responsive systems. Combined with strong cybersecurity and privacy protections and with integration with platforms like Amazon Alexa, Google Home, and Apple HomeKit, these innovations give homeowners greater control, convenience, and peace of mind. Staying informed about these trends helps ensure a safer, more connected, and confident living environment for the entire household.

 SCIENCE9 months ago
The Baby Alien Fan Bus Chronicles
- BUSINESS9 months ago
Mastering the Art of Navigating Business Challenges and Risks
- WORLD7 months ago
Money Heist Season 6: Release Date, Cast & Plot
- BUSINESS9 months ago
Newport News Shipbuilding Furloughs Hit Salaried Workers
- BUSINESS6 months ago
Top Insights from FintechZoom.com Bitcoin Reports
- WORLD9 months ago
Rainborne Royals: The Rise of Winged Termites
- TECH7 months ago
VK Video Downloader: How to Save Videos Easily
- WORLD9 months ago
Rainwalkers: The Secret Life of Worms in the Wet